RSS

Introduction:


As you may already know the housing market in the lower mainland and especially Vancouver is one of the more expensive in the world.  From time to time you may have asked yourself why that is?  That’s why this week at Mitten Real Estate Team we are going to look at some of the fundamental factors that contribute to the housing prices and popularity of the housing market in the lower mainland.


Constrained Geography:
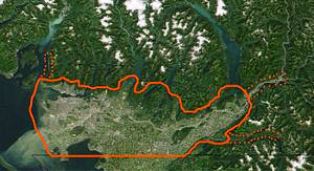

The Lowermainland


The First Reason that prices have risen in the lower mainland over time is that there is a limited amount of space for building.  Geographically the region is contained with mountains to the north and east, the U.S boarder to the south, the Fraser river runs through the middle taking up space and the Pacific ocean is located to the west.  Additionally, as a way to preserve farmland a large portion of the land in the Lower Mainland was designated as part of the Agricultural Land Reserve (ALR) many years ago. This of course further restricts the space available for development.  Thus as our population grows and more people want to live here the value of the land will increase over time.  Now this is not to say that an oversupply of certain types of housing in certain areas can’t happen short term, however long term the limited land area will support upward movement in prices long term especially as population increases.


International Trade


International Trade


With the lower mainland being located on the pacific coast of Canada, having a river running through it and having the U.S Boarder to its south it is only natural for this area to be a hub of international trade.  This trend has been accelerated in the past few decades as China and other countries in Asia gain importance in the world of international trade.  Thus, since we essentially live in a gateway city for international trade, the value of land here is going to increase as a result of the economic activity generated by trade.


Safe Geopolitical Environment:


Another very important reason why demand for housing in the lower mainland is strong is that our area is in a politically stable and is far away from any instability.  This is quite important because people naturally seek out safe areas of the world with relatively predictable laws.  And it is this stability that at least in part allows people to feel comfortable in spending large sums of money on housing and investing in housing, since they know they are investing in a safe area.


Good Weather

Good Weather


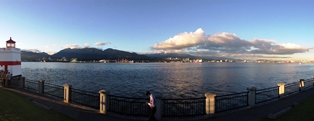
In B.C a lot of us like to complain that it rains a lot, however compared too many areas of the world and Canada, the climate in the lower mainland is very temperate, predictable and nice.  Yes it does rain a fair bit in the winter, however floods are relatively rare and large snow accumulation is also rare, making the mild winters easy to deal with.  Additionally, the summers are usually quite nice and sunny but temperatures rarely clime very high and drought is fairly rare.  Once more the spring and fall are quite mild with few severe storms. The reason for this is that the prevailing westerly winds passing over Pacific Ocean, then across the lower mainland are warmed by the water in the winter and cooled by it in the summer, resulting in a very nicely regulated climate that usually prevents extreme temperatures and extreme storms. Also since the ocean current that run by the lower mainland are coming from the north they do not allow this part of the ocean to heat up enough to develop hurricanes (except on very rare occasion).  The trade-off for all of this is of course a bit of rain in the winter.  This favorable climate helps drive the demand for housing in the region because not only is it nice weather for people to live in, but the weather does not generally interfere with the economy since extreme weather is historically rare compared to other regions, which encourages investment and economic activity in the region.


Beautiful Scenery:

BC Scenery


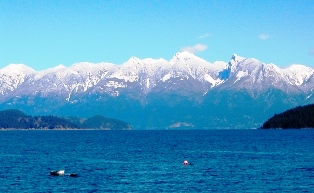
If you live in B.C seeing the ocean or a beautiful mountain vista, is probably a regular thing for you.  However, this is not so everywhere, and people are driven to these fantastic views.  This of course means people want to visit here, leading to economic activity from tourism.  Also lots of people want to live in a beautiful place which again fuels demand for housing in the region.  Oh and don’t forget the draw of all those ski mountains nearby, meaning you can live anywhere in the region and still ski regularly in the winter without a large drive.


Multi-Culturalism:


In addition to all of these other factors the lower mainland is very multi-cultural and welcoming to new immigrants to Canada.  As a result it is one of a few places in Canada that people newly arriving to the country are drawn to and of course that means they want to live here, which again drives demand for the housing market.


Foreign Investment:


For all of the reasons listed above, B.C’s lower mainland is a great place to live and has a lot of factors driving the housing market.  This of course naturally catches the attention of foreign investors who want to invest in a relatively safe area that has many positive attributes.  Many people complain about foreign investment ‘driving-up prices’, while it is true that foreign investment is a contributing factor to higher housing prices in the region, investors only invest here because of all of the other supporting factors and instead of being bitter about prices we could also be thankful as real estate owners/investors that there is a large pool of international investors willing to pay a fair amount for housing in the area which provides us with extra security against any large or fast price decreases and allows prices to be sustainable at higher levels than would otherwise be possible.


Conclusion:


While you may have sometimes heard talk of a ‘housing bubble’ in our area or prices are too high based on historical rent to price ratio’s, the consensus seems to be that the housing market in the lower mainland has so many positive factors driving demand that there is really no reason to fear any sort of housing crash in B.C.  Now this is not to say that we never see any corrections in housing prices but demand for housing in the region will always be driven by these positive fundamental factors which will support housing prices long term.  These positive factors are also the reason that the prices in the region are higher than other areas of Canada and yet are sustainable at those higher levels.


As always if you have any questions about this blog article or any other real estate related questions please feel free to contact us.  We can be reached through this website or you can phone us directly at 604-882-8384 we would be happy to assist you.


Sincerely,


Doug, Bonnie and David Mitten

Mitten Real Estate Team.

Read

I have listed a new property at 21755 61ST AVE in LANGLEY.
8 Plex in Langley - Fantastic opportunity for discerning investor. Well run & well maintained project w/8 legal nonconforming 2 bdrm rental units (duplex & 6 plex) on 2.67 ac. Boasts great income, well looked after building with many recent updates including roofs, furnaces, sewage treatment plant and more. Workshop, storage building, paved d/w & parking. Centrally located rural location just minutes to all of the amenities in Langley. Drilled well w/lots of water. Super investment w/great income, a super return on investment and primarily longer term tenants. A great investment for the astute investor.
Read

Introduction:


At Mitten Real Estate Team we are pleased to bring you our latest blog article: an update on the Aldergrove real estate market perfomance in August 2014 v.s August 2013.  This article was complied as part of our ongoing market research as a service to our clients and potential clients.


Community Information.

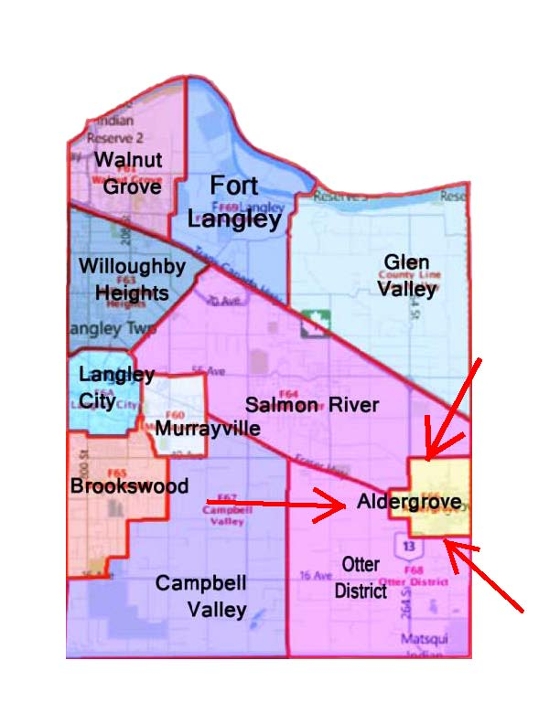
Aldergrove is located in the south east side of Langley (see the map below).


Map of Aldergrove Location


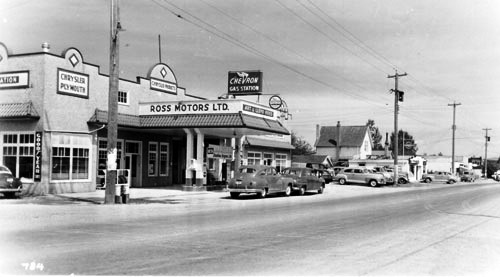
Aldergrove is one of the older communities in Langley.  In the 1870’s Gold Miners and farmers began to settle in the area, it was named Aldergrove because of all the Alder trees in the area.  In 1914 the Aldergrove post office opened, in the 1920’s the first store opened and in the 1930’s the community was connected to electricity.Aldergrove saw a fair bit of growth in the 1950-1970’s and continues to see growth to the present.  Today Aldergrove has a population of 12,778 people.


Aldergrove 1958 cira

Aldergrove 1958 cira


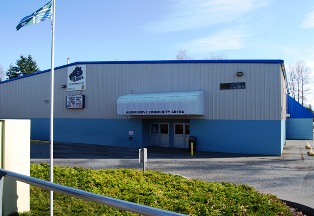
Aldergrove has a number of shops and amenities along and near Fraser Highway that runs through it.  Some of the recreation facilities include various Althletic parks and an ice arena.


Aldergrove Ice Arena

Aldergrove Ice Arena


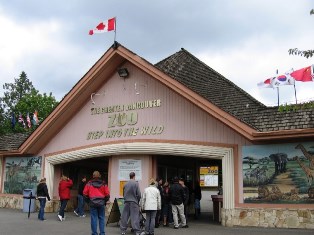
In Addition to the parks and the ice arena Aldergrove also has the Greater Vancouver Zoo nearby.


The Greater Vancouver Zoo.

Greater Vancouver Zoo


Aldergrove has a number of housing options, single family detached homes make up the largest portion but there are also a number of apartments and townhomes in the area and even a few acreages.


Single family Detached Homes.


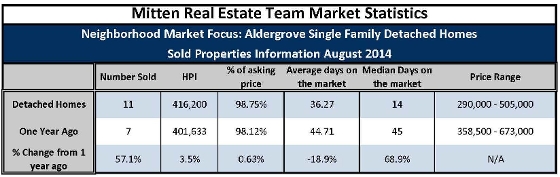
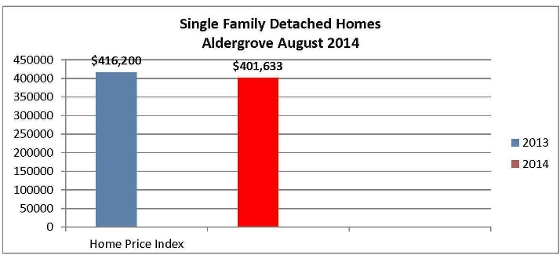
During August 2014 there were 11 sales of single family detached homes in Aldergrove compared to 7 sales in August 2013.  Single family detached homes in Aldergrove saw a 3.5% increase in prices while the average days on the market required to sell dropped 18.9% to 36.27 days.


Aldergrove August 2014 Single Family Home Sales


August 2014 Single Family Home Prices (Aldergrove)


From this Data it would seem to suggest that the market for Single Detached Homes in Aldergrove is Strengthening with a modest increase in prices, increased sales activity and a reduction in the average time required to sell.


Townhomes


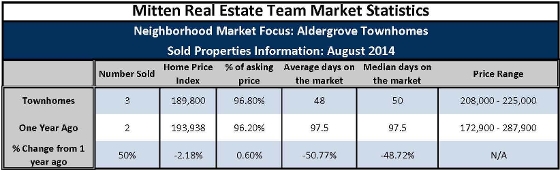
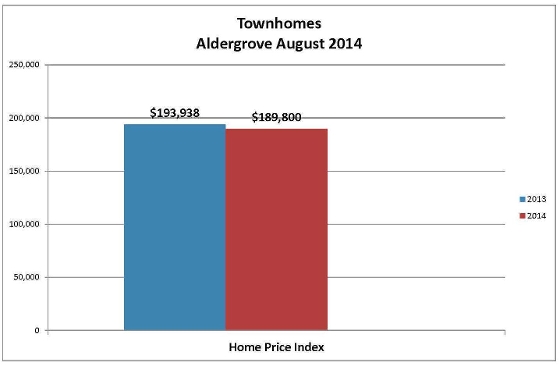
During August 2014 there were 3 sales of townhomes in Aldergrove, this was up from 2 sales that took place in August 2013.  Townhomes saw a 2.18% decrease in price however the average time required to sell dropped from 97.5 days to only 48 days. 


Townhomes Sales August 2014 (Aldergrove)


 Aldergrove Townhome Prices 2013 v.s 2014


This data suggests that while prices of Aldergrove townhomes dropped slightly during the last year the market is moving toward equilibrium with a reduction of the days required to sell and an increase in sales activity.


Apartments


During August 2014 there were no sales of Apartments in Aldergrove, additionally there were no sales of Aldergrove apartments in August 2013 either.  In total there have been only 10 sales of Apartments in Aldergrove in the last 13+ months.  Although we have not enough data to say much about the market it would seem this segment of the Aldergrove market is in tough shape, with the likely cause of the very low sales volume being a sort of ‘stand-off’ between buyers and sellers over price.


Active Listings:


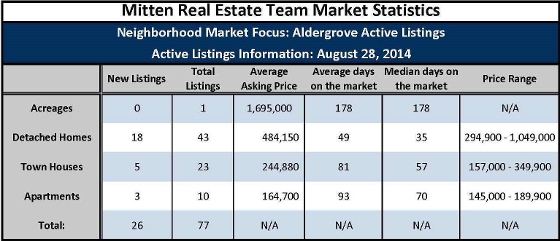
As of August 28, 2014 there were a total of 77 Active listings for sale in Aldergrove, with 26 being new listings.  There was one acreage listed.  There were 43 single family detached homes listed with 18 being new listings.  The average asking price of single family detached homes was $484,150 and the price range was from $249,900 to 1,049,000 with the listings having spent an average of 49 days on the market.  There were 23 Townhomes for sale in Aldergrove with 5 being new listings.  The average asking price was $244,880, they ranged in price from $157,000 to $349,000 and have spent an average of 81 days on the market.  There were 10 apartments for sale in Aldergrove with 3 being new listings.  The average asking price was $164,700 and the price range was $145,000 to $189,900 with the average time spent on the market being 93 days.


Aldergrove Active Listings


Conclusion

As we have seen in other areas, the market is in Aldergrove varies quite a bit based on the market segment.  The Market for Single family detached homes is strengthening with modest price gains, increased sales and a reduction in the time required to sell compared to a year ago.  The market for Aldergrove townhomes has seen a small deduction in prices, however there has also been an increase in sales volume and a reduction in the time required to sell suggesting that this market segment is moving towards equilibrium if all other factors stay the same.  The market for apartments in Aldergrove could not be analyzed due to a lack of sales.  However, this suggests that buyers and sellers are not coming to terms on prices meaning the market may need to see some price reductions before sales volumes start to increase.

Read

Introduction:


At Mitten Real Estate Team we are pleased to bring you our latest Blog Article about interest rates and their effect on the real estate market.  It is our hope that as a current or potential real estate owner/investor this article will help you be able to understand how interest rates affect the real estate market.


Interest Rates:


Interest rates are essentially the ‘time value’ of money.  The interest rate is how much a borrower pays a lender for the use of their money.  Additionally, interest rates are also meant to compensate the lender for the risk of loaning the money to the debtor since there is not a 100% guarantee it will be repaid.


Central Bank Interest Rate: (Also Known as the overnight interest rate or key interest rate)


The central bank interest rate in the interest rate at which the central bank of a country lends to domestic banks.  These loans are very short in duration and are used because the amount of money a bank has fluctuates daily based on its lending activities and its customers’ withdrawal and deposit activity, the bank may experience a shortage or surplus of cash at the end of the business day. Those banks that experience a surplus often lend money overnight to banks that experience a shortage so the banking system remains stable and liquid. (Source: Investopedia)


The Central bank interest rate (overnight interest rate) is a very important interest rate because it affects the rates at which banks lend money to customers as well as other banks, which has a large influence on the economy and employment.  The Bank of Canada makes announcements on interest rates eight times a year, the exact dates are decided on each year and the dates are published.


Prime Rate 


The ‘prime interest rate’ is the interest rate at which commercial banks lend to their most credit worthy clients.  Although the prime rate is closely related to the central bank rate set by the central bank it is not the same as the central bank rate, and is somewhat higher than the central bank rate, depending on the bank.


Inflation and interest rates:


Inflation is referring to a loss of purchasing power over time resulting from the rising price of goods and services.  For example if a package of gum was $1.00 today and the inflation rate was 2%.  In one year the pack of gum would cost $1.02.  Inflation is measured using the consumer price index (CPI), which is essentially a bundle of goods and the market price of each is monitored to determine inflation.  Most central banks aim for an inflation rate of 1-3% which is viewed as being healthy for the economy.  As a general rule as the economy strengthens inflation tends to rise, if inflation gets out of control then purchasing power can be eroded too quickly, so the central bank will raise interest rate to slow inflation, which also slows the economy.  Alternatively if the economy is weakening and inflation is stagnating the central bank will lower interest rates in help strengthen the economy.

There are several economic theories that explain these concepts in detail but they are beyond the scope of this article.


Interest Rates and Affordability:


When interest rates are low people are more likely to borrow money so that they can make investments in productivity (such as equipment, hire new employees and invest in their businesses etc…), because borrowing the money is relatively inexpensive.  This borrowing and investment in productivity in turn stimulates the economy to grow and often eventually causes an increase in inflation as a result.

When inflation rises the central bank raises interest rates.  When this happens the interest rate for borrowers increases and it becomes more expensive (less affordable) to borrow money to invest in productivity, thus less people borrow money and most business/people will cut back on spending thus slowing the economy and inflation.


Interest Rates and Investments:


As a general rule when interest rates are low, debt investments such as bonds tend to have a lower yield making them less attractive to investors, during low interest rate environments’ equity investments such as stocks in companies tend to be more attractive to investors because the companies are able to make use of the inexpensive debt to grow and offer a higher yield to investors.  This coupled with the low yields of debt investments tends to make stocks more attractive to investors when interest rates are low.


Interest Rates the Real Estate Market:


When interest rates are low financing of real estate becomes more affordable then when rates are higher, thus allowing more people to ‘afford’ real estate and this in turn can put an upward pressure on prices of real estate.  However, interest rates are usually lower when the economy is weak which can mean less people are in a position due to unemployment etc…

To see the effect interest rates can have on affordability let’s look at one example:


If a person took out a $300,000 mortgage on home at a 3% interest rate with a 25 year amortization their monthly payments would be $1,419.74


If the same person took out a $300,000 Mortgage on a home at a 4% interest rate with a 25 Year amortization their monthly payments would be $1,578.06


As you can see from this example if interest rates are 1% higher the same $300,000 mortgage would cost the borrower an extra $158.32 a month in interest.


However as was mentioned earlier even though housing becomes more expensive to finance when interest rates are higher, usually the economy is stronger as well which means people can afford to spend more since they may be making more money.  Nonetheless higher interest rates can put somewhat of a downward pressure on home prices.

An additional market phenomenon is that often after a potential raise in interest rates is announced there is a short period where the real estate market actually increases in activity.  The main reason for this is that potential purchasers who have already been pre-approved at low interest rates will ‘rush’ to buy before their pre-approval at the lower rate expires.


Conclusion:


To conclude at Mitten Real Estate team we hope that this article has helped you better understand interest rates and how they affect the real estate market.  As always if you have any questions about this article or any other real estate related questions please contact we are always happy to help you and we always have time to help you plan for the future.  We can be reached through this website, by e-mail at dbmitten@mitten-realty-services.com or at 604-882-8384.


Sincerely,


Doug, Bonnie and David Mitten (Mitten Real Estate Team)


Read

I have sold a property at 9837 McKinnon CRES in Langley
I have sold a property at 9837 McKinnon CRES in Langley.
Spectacular 17.96 acre estate property on city water in prime location across from the Fort Langley golf course. Enter through electronic gates and down a long winding driveway to the gorgeous 3,538 sfquare foot executive rancher ith a loft, pool and gorgeous views of Mt. Baker. This fantastic home is extensively updated to the highest caliber this gorgeous home boasts spacious open plan, spectacular finishing, dream island kitchen with granite counters, breakfast bar and stainless steel appliances and so much more. There is also a 70 x 70 deluxe barn with 9 stalls, hay storage, tack room with office, wash racks and parking for equipment and horse trailer coupled with outdoor riding ring and rolling pastures makes this a great spot for the equestrian enthusiast. 50' x 40' deluxe, heated and insulated shop with 14' overhead door & mezzanine, above the 14' ceilings. This is a once in a lifetime property and a must see!
Read

I have listed a new property at 18364 58B AVE in Surrey.
Super family home on absolutely gorgeous lot in great area boasts many of the major updates including: roof, windows, heat pump, furnace, gutters & hotwater tank. This super home is neat & clean & with the updates that have been done wouldbe a great candidate to finish with cosmetic updating & to finish the bsmt to your desires. Entertaining is easy in the spacious living rm w/gas f/p. Dinrm w/door to covered sundeck overlooking attractive yard. Upper level w/1.5 baths & 3 bdrms incl Mbdrm w/2pc ensuite. Lower level is ready to develop to your desires w/RI bath & room for kitch, bdrm & livrm. Dbl garage. Gorgeous fenced lot. An absolute must see and a great value.
Read

We are pleased to bring you our latest article in our ongoing ‘Neighborhood Market Focus’ series.  This article takes an in depth look at Langley’s Walnut Grove neighborhood.  This report was done as part of our ongoing market research and as a service to our clients and potential clients


Community Description:


Walnut Grove is a nice community located at the northern side of Langley township, directly South of the Fraser River and north of highway 1, with Port Kells, Surrey to the west and Fort Langley to the East. .  Walnut Grove was developed into an urban area mainly through the 1980’-1990’s, although some developments are more recent.


Walnut Grove is a well planned walkable community with numerous walking and biking trails and a good road network.  Walnut Gove has many community amenities including several parks and schools with the most notable being Walnut Grove secondary school and the Walnut Grove community center.  The recreation center is an excellent facility which has an indoor pool, gym, gymnasium, library, outdoor tennis courts and numerous sports fields and a running track.  Walnut Grove has a number of amenities in its commercial areas, such as grocery stores, the colossus movie theatre, Sportsplex ice and roller arena and numerous restaurants, there is also a growing commercial/ industrial area in the north west corner.


The Walnut Grove Community Center


The Walnut Grove Community Center Pool


The Colossus Movie Theatre


Sports Plex Ice and Roller Arena


Walnut Grove has a diverse array of housing options from seniors retirement residences, to apartments, townhomes, adult oriented town homes in gated communities, single family homes and even some acreages.  Overall walnut grove is a safe friendly well planned community in Langley Township.   


Apartments


During the July 10 – August 10, 2014 time Period there was 4 sales of apartments in Walnut Grove which was a notable drop compared to the 6 sales during the same period last year.  The Home Price Index (HPI) for apartments in Walnut Grove also saw a drop of 2.89% compared to the same period one year ago, however the average days that it took for apartments to sell dropped by 50.42% to 59.5 days.  This would seem to suggest that although prices have dropped somewhat from last year sales are happening more quickly meaning that buyers are likely becoming more receptive to apartment asking prices compared to last year resulting in quicker sales.


Townhomes


During this time period there were 12 sales of Walnut grove townhouses, 6 of which were adult oriented.  This is down notably from last year when there was 22 sales of townhouses (9 of which were adult oriented) in the same time period.  The Home Price Index for townhouses in Walnut Grove saw a modest increase of 1.01% compared to the same time last year, and the average days on the market required to sell decreased to 31.7 days.  Overall this would seem to suggest that the market for townhomes in Walnut Grove is strengthening slightly, however most of the strengthening can be attributed the Adult oriented sector of the townhouse market.


Single Family Detached Homes


During this Time Period there were 14 sales of single family detached homes in Walnut grove which was down from 20 that occurred during the same period last year.  The Home Price Index for single family homes showed a respectable gain of 5.43% compared to the same period last year while the time to sell was significantly decreased to only 11.3 days.  This data would suggest that this segment of the market is ‘heating up’ as the demand for this type of housing in Walnut Grove is high resulting in quicker sales and rising home prices.


Acreages


Although there are a few acreages that are sold in Walnut Grove, this segment of the market is very small and sales are relatively few and far between, making analysis difficult, however at current there are 4 acreages for sale in Walnut Grove.


Active Listings 


There are currently a total of 145 active listing in Walnut Grove, with 61 properties being listed within the last 30 days.


This chart shows all of the active listings in walnut grove by category as of July 11, 2014


Conclusion


In conclusion as we have seen in other areas the market in walnut grove varies significantly based on the market segment.  The apartment market has seen a modest drop in prices but a decrease in how long it takes for apartments to sell suggesting that prices may start to stabilize or at least see a slower decline in the future if other factors stay the same.  The Townhome market is starting to show a very modest bit of strengthening however looking through the data it would seem that this can be mainly attributed to a strengthening in the Adult oriented Townhome market, which is not surprising given the lack of any new construction of adult oriented townhomes and with aging demographics it seems reasonable to assume this is a trend that should continue if other factors stay the same.  Single family detached homes in Walnut Grove are continuing to show strengthening as the demand rises for this type of housing, prices have risen by 5.43% in the last year and the time required to sell has dropped to a quick 11.3 days on the market.  This would seem to suggest that if other factors stay the same the single family detached homes market segment in Walnut Grove may continue to see a strengthening in the near future.


As always if you have any questions about this article, any other real estate related questions or you are thinking of buying or selling  please contact us we would be happy to assist you.  We can be reached either through this website or by calling 604-882-8384.


Sincerely,


Mitten Real Estate Team


Read

I have sold a property at 5169 224 ST in Langley.
Fantastic 3623 square foot family home on gorgeous large lot with RV parking must be seen to appreciate. Boasting gorgeous curb appeal with Craftsman styling, covered front porch and paving stone driveway . Foyer with attractive laminate. Entertainment sized living room with gas fireplace and columns separating it from spacious dining room provide a place for more formal entertaining. Gorgeous island kitchen with laminate floors, scads of white cabinets and eating area with door to huge rear deck and yard. Family room adjoining kitchen with laminate floors and gas fireplace. 4 bedrooms and 2 bathrooms up including spacious master bedroom with 4 piece ensuite with separate shower and soaker tub. Finished lower level with 2 bedrooms, 4 piecece bath, living room and summer kitchen provide an opportunity for nanny or with a little work has possibility for legal suite.
Read

Here is a link to the latest fraser valley real estate board market statistics for July 2014.


http://www.fvreb.bc.ca/statistics/Package%20201407.pdf


Next week we will be featuring a market update on another local community so please check back soon.


As always if you have any questions about this article or any other real estate related questions please feel free to contact us we would be happy to assist you.  we can be reached through this webiste or by phone at 604-882-8384.


Sincerely, 


Doug, Bonnie and David Mitten

(Mitten Real Estate Team)

Read

If you have ever thought about investing in a rental property but are unsure if it made financial sense this article is for you!


Buying a rental property is very different from buying your personal home, in that a rental property in a financial investment and it must generate a reasonable return on your investment in order to be worthwhile.  So how do you know if buying a rental property is worthwhile? Keep reading to find out…


As a real estate investor you must analysis properties from a finance perspective…  A very important finance calculation is the C.A.P rate.


Capitalization Rate


The Capitalization Rate (Cap rate) is a mathematical expression how much monetary return you will receive on your investment.  In other words the percentage return an investor would receive on an all cash purchase.


The Formula is:


Essentially to determine the capitalization rate you take the net annual operating income(NOI) and divide it by the purchase price of the property.  However before we can determine the cap rate of a property you must determine the annual net operating income.


Annual Net Operating Income


The calculation for determining the annual net operating income:


So to calculate NOI you would take the gross operating income (annual projected rent) and subtract all the operating expenses.  Operating expenses would include thing such as:


-Insurance

-Property Taxes

-repairs and maintance

-Property Management (if applicable)


However, it is important to note a few expenses are not part of the NOI, these include income tax on profit and mortgage interest.


CAP Rate Example


To demonstrate how to use cap rate here is a fictional example…


$510,000 Basement Home in Walnut Grove, 2400sqft with double garage, This home has a projected monthly income of $2,500/mo.


2,500 x 12 = $30,000 (Annual Gross Rental Revenue)


Operating Expenses are:


$2,500 /yr insurance +


$3,600/ yr Repairs, +


$3,600 / yr Property Taxes


Total Operating Expenses = $9,700


Using the above formula we can calculate NOI to be $20,300


From this we can use the formula determine the cap rate…


20,300/510,000 = 3.98% So the capitalization rate of this particular (fictional) home would be 3.98%


From this we can also determine the payback period as follows…


510,000 / 20,300 = 25.1 Years or 301.5 months.


The Payback period refers to how long it will take to recover your investment through collecting  net income genrated by the property..


Now, of course our example assumes that an investor plans to hold the rental property indefinably, but in reality many investors do sell properties at some point in which case they may also realize a profit when they sell their property especially if they have held it for many years.  Any gains in property value made at the time of selling would usually be subject to capital gains taxation, just as most other investments would be...


Uses of Cap Rate:


  • Cap rate can be used to determine the fair value of a rental property compared to other properties in a similar area.


  • Cap Rate can be used to decide between investments types eg.( Real Estate v.s bonds)


  • Cap Rate can also indicate risk, for example properties in one area of a city may have a higher cap rate because there is less demand for rentals in the area so they carry a higher risk of vacany. Some other examples of risk that can affect cap rate are, age of a property, credit worthiness of current tenants (if applicable), length of lease in Place (if applicable), etc…


  • Cap rate can also be s sign of how much demand there is in the market for a certain type of property, meaning if a trend of cap rate decreasing for a certain type of property is observed, the market for this type of property is heating up and prices are being bid up thus reducing the cap rate.


What About Vacancy?


Vacancy is an important consideration for potential investors. And on the long term vacancy does effect cap rate.  However the expected vacancy rate can vary significantly based on the area type of property etc…


Example: If in the area a 2 week per year vacancy was expected you would deduct half a months rent from the Gross Rental Revenue.


For the example we discussed above this would reduce the Gross Rental Revenue to $28,750 (from $30,000) and the NOI to $19,050 (from $20,300) resulting in a C.A.P rate of 3.74% and a 26,8 Year (or 321.3 months) Payback period.


Thus projected vacancy is an important factor to consider when calculating cap rate, but the projected vacancy rate will vary based on area and the type of property.


What about Mortgage/Financing Costs?


Mortgage payments are generally not included in the calculation of C.A.P rate.  The reason for this is that financing costs from leveraging can very significantly based on credit history as well as down-payment etc.. which would result in a skewed CAP rate if they were included. 


However interest expenses on mortgages of investment properties are usually tax deductible so using a mortgage (leveraging) when investing in real estate can have tax benefits, talking with an accountant would be advisable if you are considering using leveraging (a mortgage) when purchasing a rental property as a way to reduce tax on the revenue.

Although it is not included in CAP rate calculations, financing is a very important aspect in determining if a rental property will make sense financially.  Speaking with a good mortgage broker about you ability to finance the purchase and the interest rate avaible is advisable. If you are thinking of buying a rental property using a mortgage and you are not currently working with a Broker please contact us and we can direct you to good mortgage broker who can disscuss what financing options are avalible to you.


Conclusion:


As a current or potential real estate investor, Capitalization rate and other financial considerations are key to making sure that you receive a good return on your investments, which is why we have written this article as a service to our current and future clients, that will help them better understand the finance apect of investing in real estate rental properties.

  This article should be considered as a good introduction to some of the useful finance concepts that can be used when deciding to invest in rental properties.


This article is however, not intended to be a comprehensive guide to the finance side of real estate investing.


 If you are thinking of investing in rental properties in B.C’s lower-mainland as part of your investment portfolio please contact us we would be happy to discuss some of the finance concepts you should consider when investing as well as assist you with finding a property that would suite your investment goals. We can be reached through this website or by phone at 604-882-8384.


Sincerely,


Doug, Bonnie and David Mitten (Mitten Real Estate Team)


Read

At Mitten Real Estate Team we are pleased to bring you our third article in the neighborhood market focus series.  In this article we will analyze the real estate market in Cloverdale during the June 23 – July, 2014 time period and compare it to the market one year ago.  As a quick note only the ‘Traditional’ area of Cloverdale is being analyzed in this article, the newer Clayton area was not included but we will look at that area in one of our subsequent articles.


Apartments


From June 23- July 23, 2014 there were 6 sales of apartments in the Cloverdale area, which was the same is the previous year, additionally there was a notable increase in the time it took for apartments to sell with the average days on the market increasing to 62.5 days compared to 23.5 days in the previous year.  The Median days on the Market also increased from 21.5 days to 33 days.  This shows that it is taking longer for most apartments to sell.  Additionally, there was a notable 28% reduction in the average sale price of apartments in Cloverdale.


Based on these results it would seem that the market for apartments in Cloverdale is notably weaker than on year ago, with a significant reduction in average sale price and an increase in the time it took for apartments to sell in the area.


Townhomes


During the June 23 – July 23, 2014 time period there were 7 sales of townhomes in Cloverdale, compared to 15 one year ago.  The average sale price saw an increase of 6.51% while days on the market increased slightly.


Cloverdale townhomes average selling prices July 2014 v.s2013


These results are somewhat mixed the lower number of sales, usually points to weakening, however the higher sale prices points to a strengthening of the market.  If we look at the economic theory of supply and demand, we seem to get a satisfactory explanation in that although prices rose slightly less people bought at the higher prices meaning the market for townhouses in Cloverdale is fairly steady or slightly strengthening with some price increases at the expense of lower sales and longer sale times.


Single Family Detached Homes


During this time period there were 33 sales of single family detached homes in Cloverdale compared to 43 the previous year.  The Average sale price decreased by 1.49% compared to a year ago with the average time on the market increasing by 9.5 days.


For these results we can conclude that the market for single family detached homes has weakened slightly since one year ago, however looking at the data, the weakening is fairly mild.


Active Listings


In Cloverdale, during this time period there were a total of 341 properties for sale in Cloverdale, and 98 Properties were New Listings.  The largest segment of listings was single family detached homes with 211 listings, 66 of which were new listings. The second largest was Town homes with 79 Properties for sale and 16 new listings.  There were 51 apartments for sale in Cloverdale with 16 of those being new listings.  These numbers represent a decent amount of ‘inventory’ in the Cloverdale market.


Conclusion


In Conclusion it would seem that the Market for apartments in Cloverdale has weakened somewhat since last year with prices seeing a 28% drop on average, in addition to apartments taking longer to sell.  The market for Townhomes has seen some price increases but some loss of market activity.  Finally the Market for Single Family detached homes has slightly weakened since last year, but the weakening is fairly mild.

As Always if you have any questions about this article or any other real estate related question please contact us we would be happy to talk with you. We can be reached through this website or at 604-882-8384.


Sincerely,


 Mitten Real Estate Team

Read

At Mitten Real Estate Team we are pleased to bring you our second article in our series titled ‘Neighborhood Market Focus’ which is based on our ongoing market research and experience.  This article is focused on Langley’s Murrayville area from June 22 – July 22, 2014.


Community Summary


Murrayville is a very nice, safe and walkable community.  Murrayville was mainly developed throught the 1990's however some development took place afterwards and a few areas of murrayville are continuing to develop today.  Murrayville has a number of ammenities including both the main RCMP station as well as Langley's hospital...


In addition to these ammenities Murrayville also features a number of other ammenities such as the WC Blair Wave pool and recreation center and several unique restaurants as well as coffe shops, a bank etc.. All in all Murrayville is one of the nicer communites in Langley and features a variety of housing options from single family homes to apartments, townhomes and even seniors retirement homes.


Single Family Detached Homes:


From June 22- July 22, 2014, there were 6 sales of single family detached homes in Murrayville.  This is down from 12 sales the year before.  However the home price index saw an increase of 8.18% compared to the same time last year and it took less time for single family detached homes to sell.


Therefore even though there were fewer sales during the last month than there were last year at the same time, the Home price index was notably higher and the time on the market was notably reduced, meaning the single family detached homes segment in Murrayville has showed strength compared to last year.


Townhouses:


From June 22 – July 22, 2014, there were 6 townhome sales in Murrayville, which was a notable increase compared to only 2 which occurred during the same time last year.  The Home price index during the last month was up 12.61% compared to one year ago.  Additionally, the time it took for townhouses to sell dropped from an average of 96 days a year ago to only 30 during this time period


Based on the data above, it would seem that the Townhome segment of the market in Murrayville did well compared to a year ago with an increase in the home price index as day on the market required to sell being reduced  when compared to the same time one year ago.


Apartments:


During the June 22- July 22, 2014 time period there were no sales of apartments in Murrayville.  However because we still wanted to get an understanding of what is happening in this market segment we decided to move our analysis back 3 weeks to June 1- July 1  2014.


During this time period there were 4 sales compared to 5 sales one year ago.  The home price index of appartments was virtually unchanged at -0.60% compared to one year ago and the time it took apartments to sell decreased by more than 50%.


From June 1 – July 1, 2014, it would seem that the market for apartments in Murrayville unchaged from one year ago with a virtually unchanged home price index and days on the market decreaseing noticably.  Although there were no sales during the last 3 weeks the reduction of days on the market required to sell is a somewhat incouraging sign for the murrayville apartment.


Acreages:


There were no sales in acreages in Murrayville during the June 22- July 22, 2014 time period, and in fact there were only a few all of last year, making it difficult to comment on this small segment.  The reason is likely that there are very few acreages for sale in Murrayville (Listed on MLS).  In fact there is only 1 property currently for sale in this segment.


Active Listings:


During the June 22- July 22, 2014 time period there were 53 properties for sale in Murrayville and 17 new listings compared to 12 Sales.  Detached homes made up the largest segment of listings with 9 new listings and 29 total homes listed for sale, with 2 homes being New Construction in the Radius subdivision and 27 were used homes.  There were 5 new listings of townhouses during this time and a total of 10 townhouses listed for sale with 5 of the 10 being new construction in the Winchester Estates Complex, compared to 6 sales of townhomes.  There were 3 new listings of apartments with 13 total listing during this time compared to no sales.  There were no new listings of acreages with one acreage total listed for sale in Murrayville.


Conclusion:


In Conclusion the market in Murrayville seems to be showing significant differences by segment. Detached Single family residential homes seem to be showing strength compared to last year.  The market for townhomes in Murrayville appears to be notably stronger when compared to last year.  The market for apartments appears to be  almost unchanged compared to the same time a year ago.  Finally, acreages could not really be judged due to the segment being too small for accurate analysis.


Please check to see our next article in this series  to see our analysis of the real estate market In another local area.


As always if you have any questions about this article of any other real estate related questions please feel free to contact us we would be happy to talk to you.  We can be reached through this website or by phone at 604-882-8384.


Sincerely,

Doug, Bonnie and David Mitten ( The Mitten Real Estate Team.)


Read
Categories:   Abbotsford East Real Estate | Abbotsford East, Abbotsford Real Estate | Abbotsford Real Estate | Abbotsford West, Abbotsford Real Estate | Aberdeen Real Estate | Aberdeen, Abbotsford Real Estate | Aldergrove Langley, Langley Real Estate | Aldergrove Real Estate | Aldergrove, Langley Real Estate | Annieville Real Estate | Bolivar Heights, North Surrey Real Estate | Bradner Real Estate | Brookswood Langley Real Estate | Brookswood Langley, Langley Real Estate | Brookswood, Langley Real Estate | Burke Mountain, Coquitlam Real Estate | Cambell Valley, Langley Real Estate | Campbell Valley Real Estate | Campbell Valley, Langley Real Estate | Canada Real Estate | Cedar Hills Real Estate | Cedar Hills, North Surrey Real Estate | Central Abbotsford Real Estate | Central Abbotsford, Abbotsford Real Estate | Central Meadows, Pitt Meadows Real Estate | Chilliwack E Young-Yale, Chilliwack Real Estate | Chilliwack Proper East, Chilliwack Real Estate | Chilliwack Proper West, Chilliwack Real Estate | Chilliwack Real Estate | Clayton Real Estate | Clayton, Cloverdale Real Estate | Clayton, Surrey Real Estate | Clearbrook Real Estate | Cloverdale BC Real Estate | Cloverdale BC, Cloverdale Real Estate | Cloverdale BC, Surrey Real Estate | Cloverdale Real Estate | Cloverdale, Surrey Real Estate | Coquitlam West, Coquitlam Real Estate | Country Line Glen Valley, Langley Real Estate | County Line Glen Valley, Langley Real Estate | Crescent Bch Ocean Pk. Real Estate | Cultus Lake, Chilliwack Real Estate | Cultus Lake, Cultus Lake Real Estate | Downtown NW, New Westminster Real Estate | East Central, Maple Ridge Real Estate | East Newton Real Estate | East Newton, Surrey Real Estate | Elgin Chantrell, South Surrey White Rock Real Estate | Fleetwood Real Estate | Fleetwood Tynehead Real Estate | Fleetwood Tynehead, Surrey Real Estate | Fort Langley Real Estate | Fort Langley, Langley Real Estate | Glen Valley Real Estate | Glen Valley, Langley Real Estate | Grandview Surrey, South Surrey White Rock Real Estate | Guildford, North Surrey Real Estate | Harrison Hot Springs, Harrison Hot Springs Real Estate | Harrison Real Estate | Hazelmere Real Estate | King George Corridor Real Estate | King George Corridor, South Surrey White Rock Real Estate | Langley City Real Estate | Langley City, Langley Real Estate | Langley City//Murrayville Real Estate | Langley City/Murrayville Real Estate | Langley Real Estate | Mission BC, Mission Real Estate | Mission, Mission Real Estate | Mission-West, Mission Real Estate | Morgan Creek Real Estate | Morgan Creek, South Surrey White Rock Real Estate | Murrayvile, Langley Real Estate | Murrayville Real Estate | Murrayville, Langley Real Estate | New Westminster Real Estate | Nordel, N. Delta Real Estate | North Coquitlam, Coquitlam Real Estate | Otter District Real Estate | Otter District, Langley Real Estate | Panorama Ridge, Surrey Real Estate | Poplar, Abbotsford Real Estate | Port Kells, Canada Real Estate | Port Kells, North Surrey Real Estate | Port Kells, Surrey Real Estate | Quay, New Westminster Real Estate | Queen Mary Park Surrey, Surrey Real Estate | Ranch Park, Coquitlam Real Estate | Royal Heights, North Surrey Real Estate | Salmon River Real Estate | Salmon River, Langley Real Estate | Sardis West Vedder Rd, Chilliwack Real Estate | Sardis West Vedder Rd, Sardis Real Estate | Silver Valley, Maple Ridge Real Estate | South Langley, Langley Real Estate | Sulivan Station, Surrey Real Estate | Sullivan Station Real Estate | Sullivan Station, Surrey Real Estate | Sunnyside Park Surrey Real Estate | Sunnyside Park Surrey, South Surrey White Rock Real Estate | Sunshine Hills Woods, N. Delta Real Estate | Sunshine Hills Woods, North Delta Real Estate | Sunshine Hills/Woods Real Estate | Surrey Real Estate | Tall Timbers Real Estate | Uptown NW, New Westminster Real Estate | Vedder S Watson-Promontory, Sardis Real Estate | Walnut Grove Real Estate | Walnut Grove, Langley Real Estate | West Abbotsford, Abbotsford Real Estate | Whalley Real Estate | Whalley, North Surrey Real Estate | White Rock Real Estate | White Rock, South Surrey White Rock Real Estate | Willoughby Heights Real Estate | Willoughby Heights, Langley Real Estate | Willoughby, Langley Real Estate | Yarrow, Chilliwack Real Estate | Yarrow, Yarrow Real Estate
Reciprocity Logo The data relating to real estate on this website comes in part from the MLS® Reciprocity program of either the Greater Vancouver REALTORS® (GVR), the Fraser Valley Real Estate Board (FVREB) or the Chilliwack and District Real Estate Board (CADREB). Real estate listings held by participating real estate firms are marked with the MLS® logo and detailed information about the listing includes the name of the listing agent. This representation is based in whole or part on data generated by either the GVR, the FVREB or the CADREB which assumes no responsibility for its accuracy. The materials contained on this page may not be reproduced without the express written consent of either the GVR, the FVREB or the CADREB.